Planners push transit, but it’s a hard sell in Western cities
by Wendell Cox
Over the six decades that transit subsidies have been virtually universal, governments and media have urged people to give up driving and switch to transit. Yet transit’s share of total urban travel was near modern lows just before the pandemic. It is recovering more slowly than other modes of travel, as transit analyst Randal O’Toole has shown in New Geography.
Indeed, city officials often portray transit as a readily available alternative to the car. But transit can quickly access only a small fraction of destinations compared to cars for most people. This article provides data for the largest metropolitan areas in the 13 Western states.
This is not an argument for cars, but simply a recognition that cars better serve what many (including this author) consider to be the ultimate domestic public policy objectives – improving affluence and reducing poverty (see: Toward More Prosperous Cities).
Improving Affluence
Economists such as Remy Prud’homme and Chang-Won Lee at the University of Paris, as well as David Hartgen and Gregory Fields at the University of North Carolina – Charlotte, have shown a strong association between better economic performance in metropolitan areas where more jobs can be reached in a specified time (such as 30 minutes) by the average resident.
Former senior advisor to the U.S. Department of Transportation Steven Polzin noted the relationship between economic progress and faster travel times in the United States and the economic losses from spending more time than necessary commuting.
An average 30-minute travel time, also called the “Marchetti Constant,” has endured through history. In the United States, about 60 percent of workers commuted less than 30 minutes (excluding those working at home), according to the American Community Survey, 2019.
Reducing Poverty
Moreover, because cars make so many more jobs accessible, they improve household income prospects. David King and associates at Arizona State University have found that households without cars are 70-percent more likely to be in poverty. Margy Waller of the Progressive Policy Institute found that, “In most cases, the shortest distance between a poor person and a job is along a line driven in a car.” One can only wonder how much unemployment would be reduced if auto-competitive mobility were available to all residents.
Where Transit is Competitive
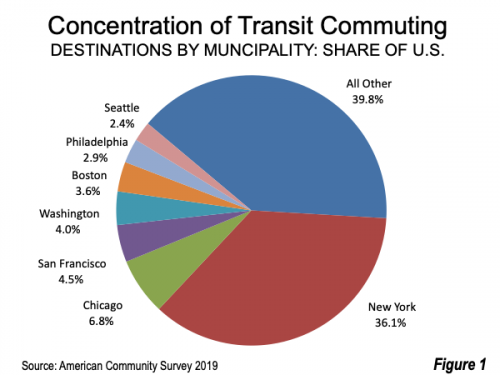
At the outset, it is clear that transit serves some needs very well. Its strength is getting people to the densest and largest downtown areas, with about 60 percent of all U.S. transit commuters destined for just seven of the nation’s nearly 20,000 municipalities (New York, Chicago, Philadelphia, San Francisco, Boston, Washington, D.C. and Seattle), which are not to be confused with their metropolitan areas (Figure 1). This is nearly 10 times their share of national employment. These municipalities are also home to the seven largest central business districts (CBDs or downtowns), toward which transit service is focused. (If it were not, transit ridership would be lower). From 40 percent to 75 percent of workers in these CBDs commute by transit. Outside these seven CBDs, commuting by car is dominant.

Where Transit is Uncompetitive
Researchers at the University of Minnesota Accessibility Observatory have estimated the number of jobs that the average worker can access in various times. Estimates are provided for cars and transit in 50 metropolitan areas over 1-million population in 2019 (data is not reported for three 1 million-plus metros – Rochester, Grand Rapids and Tucson, nor Honolulu, Fresno or Tulsa, added in 2020). Based on this data, the average car commuter reaches 56 times as many jobs by car as by transit (5,600 percent) in 30 minutes.
Realistically, there is no prospect of materially reducing this gap. Further, the reality of transit commuting is even less competitive, with about 100 car commuters per transit commuter in 30 minutes, according to ACS 2019 data.
Even in metropolitan New York City, with its unrivaled transit system, cars provide far more 30-minute job access than transit. Among commuters reaching work within 30 minutes, 5.6 times as many use cars as transit. In 2019, the average worker could reach 2.4 percent of metro area jobs (213,000) in 30 minutes by transit, and 13.2 percent (1.185 million) by car.
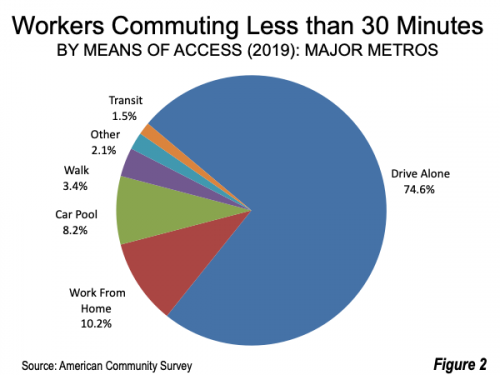
In the United States, among commuters who reach work within 30 minutes, 98.5 percent do not use transit (Figure 2) – 83.8 percent are in cars, 10.2 percent work at home and another 5.5 percent walk or use bicycles, motorcycles, taxicabs or other modes. Only 1.5 percent of workers with commutes within 30 minutes use transit, according to ACS 2019 data.

However, car commutes are not the fastest. That honor goes to working at home. During the pandemic, remote work – aided by Internet technology – kept many businesses operating. Without this, unemployment would have been far more extensive and there might have even been a recession. Many workers didn’t want to waste time commuting, especially in crowded rush-hour conditions. Corporations have adopted the hybrid work model, reluctantly or not, which may generally replace the five-day workweek with a three-day week.
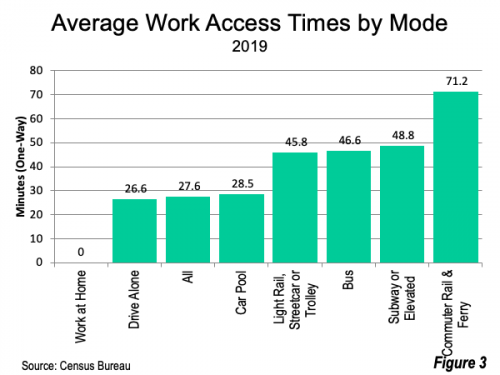
There is good reason for the differences between job access by car and transit. Car commuters can drive directly from their homes to all jobs within a 30-minute travel radius. A car has the flexibility to use any possible routing for the trip and is not required to make intermediate stops. A transit service necessarily travels over a single route and must make intermediate stops for passengers. Riders can access two or more transit routes with transfers, but this substantially reduces the jobs workers can reach in 30 minutes. Further, beyond the geographical inflexibility of its routes, transit travel times tend to be slower (Figure 3).

Auto and Transit Job Access in West
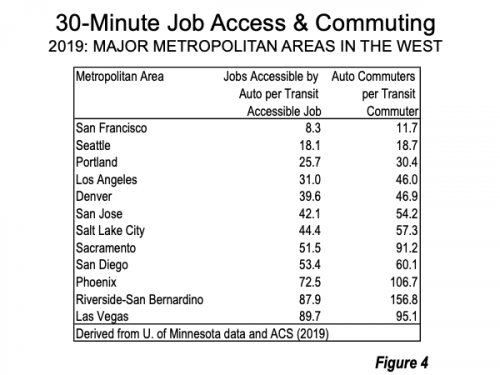
Among the 50 Western metropolitan areas, San Francisco has the best 30-minute metropolitan job access – 3.5 percent. By contrast, workers can reach 29.1 percent of the jobs in metro San Francisco by auto. In other words, there are more than eight auto commuters for each transit commuter in the San Francisco Bay Area. In metro Seattle, which has historically been the second-strongest per-capita transit market in the West, car commuters can access 18.1 times as many jobs accessible by transit in 30 minutes.
Figure 4 illustrates all Western major metropolitan areas for which there is data, as well as the actual ratio of car commuters per transit commuter. In all cases, there are more actual car commuters per transit commuter than in the estimated job access.

The Bottom Line
It’s not surprising that the government’s focus on selling transit has failed to move market share from cars to transit. People do not typically seek to make their commutes longer. In short, commuting, whether physical or virtual, is not “an end in itself.” Planners need to focus on transportation solutions that boost the economic prospects of city dwellers rather than simply selling transit.
Wendell Cox is principal of Demographia, an international public policy firm located in the St. Louis metropolitan area.
