As school boards grapple with issues ranging from poor student achievement scores in reading and math on state and national tests to widespread student behavior and discipline problems to ideological controversies, the public is less than happy with the performance of their school boards in the face of these challenges.
The results of a 2024 national survey conducted by Echelon Insights for the Pacific Research Institute on American voters’ opinion of local school boards are sobering.
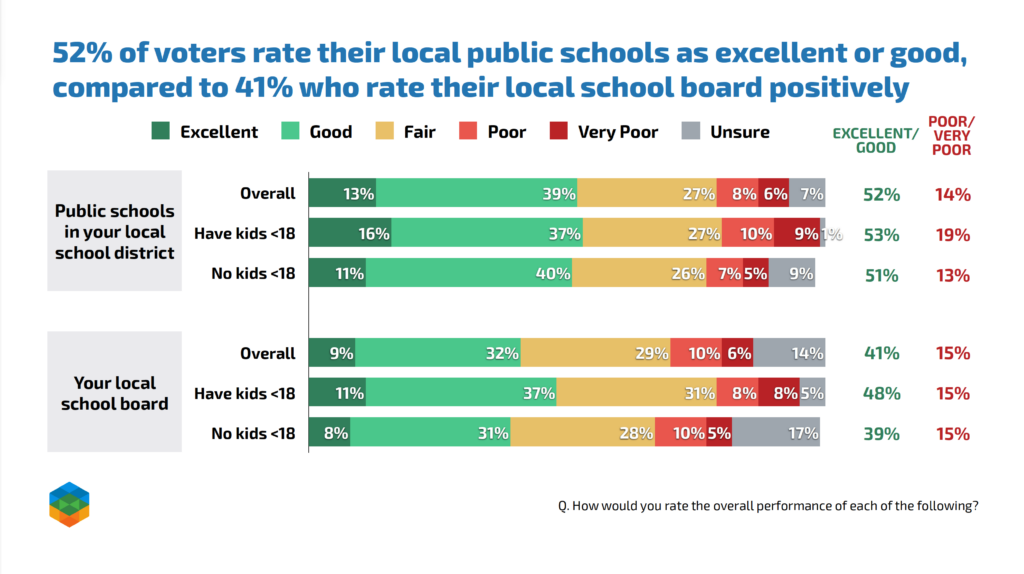
When asked to rate the overall performance of their local school board, only 41 percent gave their own school board an excellent/good rating. In contrast, 45 percent gave their school board a fair/poor/very poor rating. Fourteen percent said they were unsure.
In comparison, the rating for school boards was less positive than the rating for local public schools.
Fifty-two percent of voters rated their own local public schools as excellent/good, which was significantly higher compared to the 41 percent who rated their own school boards as excellent/good.

It should be pointed out, however, that voters’ views of public schools are more complex when they were asked to compare the performance of public schools over time.
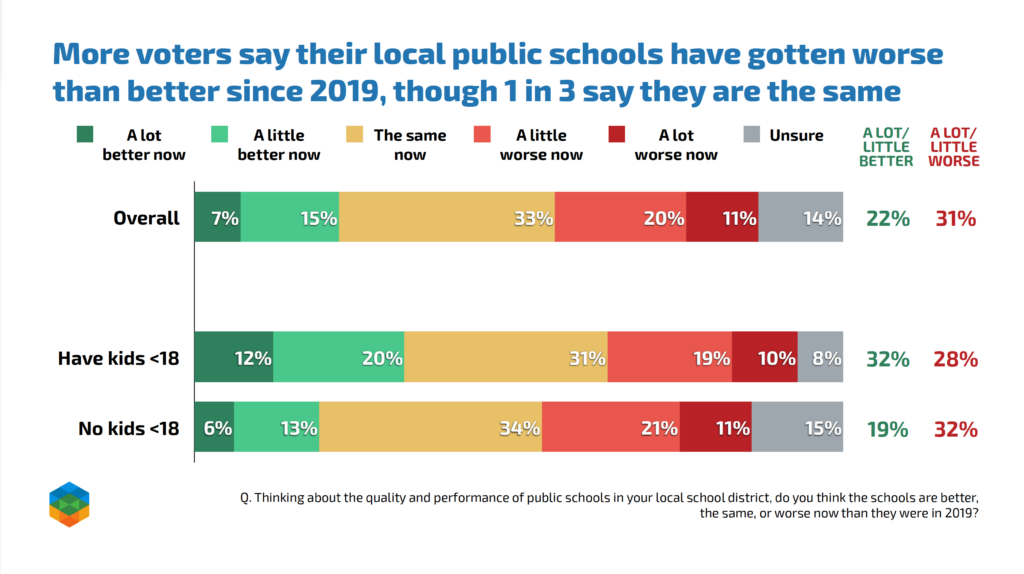
The poll found that more voters said that their local public schools have gotten worse rather than better since 2019, with 31 percent saying that their local public schools have gotten “a lot/little” worse versus only 22 percent saying their public schools have gotten “a lot/little” better. The remainder were unsure or said things were the same.
Regarding school boards, although there were some partisan differences in responses, it is interesting to note that while only 38 percent of Republicans gave their local school boards an excellent/good rating, a perhaps surprising 49 percent, less than half, of Democrats gave their boards an excellent/good rating. Fifty percent of Republicans gave their boards a fair/poor/very poor rating, while 37 percent of Democrats gave their boards a fair/poor/very poor rating.
Also of note was the finding that a lower proportion of independents had a positive view of school boards than either Republicans or Democrats, with just 34 percent of independents giving their boards an excellent/good rating versus 49 percent who gave a fair/poor/very poor rating. This 15-percentage-point gap was the largest gap amongst the three partisan groups.

For those who said that their school boards were doing their job poorly, what were their reasons for giving a low rating? When given a series of choices, 60 percent said that their board’s low performance was because board members were trying to promote their own ideological or personal agendas. Also, 55 percent said that their boards were focusing on the wrong goals. No other choice went above the 50-percent mark.
The results of this PRI survey indicate that parents and the public see room for improvement with their local schools and school boards. Boards should therefore focus on improving the performance of the schools under their supervision and putting the interests of children first in their decisions.
Lance Izumi is the senior director of PRI’s Center for Education and the author of the new book The Great Classroom Collapse.
The survey was conducted online from July 19–21, 2024 in English among a sample of N=982 voters in the likely electorate nationwide using nonprobability sampling, with a sample drawn from the Lucid sample exchange and matched to the L2 voter file. The sample was weighted to reflect modeled turnout and demographic characteristics of the population of voters in the 2024 likely electorate based on a probabilistic model that incorporates data from the US Census Bureau’s American Community Survey and Current Population Survey Voting and Registration Supplement, as well as L2 voter file data.

