Californians Have Little to Show for All That Government Spending
Wayne Winegarden
July 2024
It should not shock anyone that the FY2024-25 budget was short on fiscal discipline and long on budget gimmicks and fund shifts. Now that this year’s budget process is coming to an end, it is imperative to step back and gain some budgetary perspective.
The Governor seems to think “this agreement sets the state on a path for long-term fiscal stability — addressing the current shortfall and strengthening budget resilience down the road.” Newsom’s optimism is unwarranted given the economic realities and state of the budget. Yet, even if the Governor does not have to close another large budget gap for the FY2025-26 budget, don’t be fooled, the budget is barreling toward crisis.
This impending crisis may lack the recent drama that the balanced budget requirement periodically imposes. But if the growing problem of Californians paying too much money for sub-par government services is left unaddressed, the foundations for a prosperous economy will be undermined.
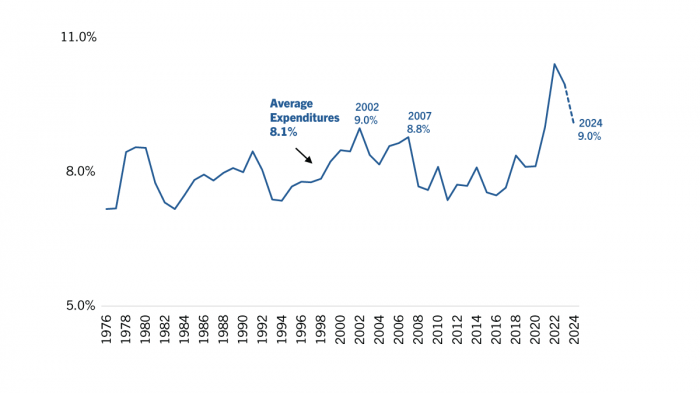
The below Figure presents California’s total expenditures, excluding federal funds, relative to total state personal income between 1976 and the estimated 2024-25 budget. An argument can be made that the state’s average expenditure burden – 8.1 percent of personal income – has been too high. The even more pressing problem is that California’s current budget is unaffordable relative to this historical level of spending.
California Still Has a Spending Problem

Source: Author calculations based on data from California Department of Finance and Bureau of Economic Analysis
KEY TAKEAWAYS
- Following the FY2024-25 budget, California state government spending will be an estimated 9.0 percent of personal income. This is a much higher burden than the historical average of 8.1 percent.
- Compared to other states, total government spending in California is 4 percent larger on a per capita basis and 16.7 percent larger relative to personal income.
- While government spending is much higher in California, state residents receive very low-quality public services compared to the other states.
- According to S. News & World Report’s assessment of state fiscal stability, California’s government is the 9th most unstable.[2]
- According to Truth in Accounting fiscal transparency in California is the 3rd Additionally, California is in the 9th worst financial position compared to the other states.[3]
- ALEC’s 17th Annual publication Rich States, Poor States ranks California as having the 4th worst economic policy environment.[4]
- The Tax Foundation ranks California’s business tax climate as the 3rd worst in the country due to the state’s excessively high marginal tax rates.[5]
[1] “Annual Survey of State and Local Government Finances” U.S. Census Bureau, https://www.census.gov/programs-surveys/gov-finances.html. [2] “Best States: Fiscal Stability” U.S. News & World Report, https://www.usnews.com/news/best-states/rankings/fiscal-stability. [3] “The State’s Financial Transparency Score 2024” Truth in Accounting, https://www.truthinaccounting.org/library/doclib/Financial-Transparency-Score-2024.pdf; “Financial State of the States 2023” Truth in Accounting, https://www.truthinaccounting.org/library/doclib/FSOS-Booklet-2023.pdf. [4] Laffer AB, Moore S, and Williams J “Rich States Poor States’ ALEC, https://www.richstatespoorstates.org/app/uploads/2024/04/2024-17th-RSPS-State-Pages_WEB.pdf. [5] Walczak J, Yushkov A, Loughead K “2024 State Business Tax Climate Index” Tax Foundation, October 24, 2023, https://taxfoundation.org/research/all/state/2024-state-business-tax-climate-index/. [6] “The Nation’s Report Card” https://www.nationsreportcard.gov/profiles/stateprofile?sfj=NP&chort=1&sub=MAT&sj=&st=MN&year=2022R3. [7] “Violent Crime Rate: 2022” https://projects.csgjusticecenter.org/tools-for-states-to-address-crime/50-state-crime-data/. [8] “Which states have the best — and worst — road quality?” USA Facts, January 9, 2024, https://usafacts.org/articles/which-states-have-the-best-and-worst-road-quality/.
