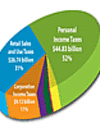
State of California General Fund Tax Revenue, Fiscal Year 2010
July 1, 2009 June 30, 2010
up 5.6% from FY 2009
Source: California State Controller (p. 12) $86.58 billion

California Tax Facts 2011 – Revenue Sour
| Personal Income Taxes | $44.83 billion | 52% |
| Retail Sales and Use Taxes | $26.74 billion | 31% |
| Corporation Income Taxes | $9.12 billion | 11% |
| Insurance Gross Premiums Taxes | $2.00 billion | 2% |
| Motor Vehicle and Trailer Coach License Fees | $1.42 billion | 1.5% |
| Excise Taxes on Distilled Spirits, Beer, Wine, and Cigarettes | $0.41 billion | 0.5% |
| Misc. Minor Revenue Sources | $2.06 billion | 2% |
Source: California State Controller (p. 12)
| State and Local Taxes (2009) $4,910 per capita (% of income) down 9% from previous year Source: Tax Foundation |
10.6% | 6th worst burden nationally |
| Federal Taxes Paid (2005) $8,028 per capita (% of income) up 13% from previous year Source: Tax Foundation |
18.8% | 9th worst burden nationally |
California Tax Facts 2011 – Tax Freedom Day
The day that the typical California taxpayer has worked enough to pay their total annual tax bill (106 days) and can start working for themselves instead of for the government (5th latest date of all 50 states and two days later than in 2010).
Source: Tax Foundation (p. 7)
California Tax Facts 2011 – Tax Incidence
The richest 7% of earners (Adjusted Gross Income > $150,000) pay 71% of the entire California personal income tax, meaning 93% of earners pay only 29% of the taxes.
Source: California Franchise Tax Board
California Tax Facts 2011 – Drilling Down
Personal Income Taxes
As of February 2011, California has the third-highest top marginal personal income tax rate in the United States at 10.3% (only Hawaii and Oregon have higher top marginal rates at 11%).
Source: Tax Foundation
As of February 2011, California has seven personal income tax rates. Only five states have more personal income tax rates.
Source: Tax Foundation
In fiscal year 2009, state individual income tax collections were $1,206 per capita in California, which ranked 6th-highest nationally.
Source: Tax Foundation
Sales Taxes
California has the highest state sales tax rate in the United States at 7.25% and the 2nd-highest combined state and local average sales tax rate.
Source: Tax Foundation
In fiscal year 2009, state general sales tax collections were $788 per capita in California, which ranked 21st-highest nationally.
Source:Tax Foundation
As of July 2010, five of the 10 cities with the highest combined sales tax rate (state, county, and city) were located in California.
Source: Tax Foundation
Business Taxes
Californias 8.84% flat corporate income tax rate is the highest corporate tax rate in the West. Nationally, only 8 states have a higher top corporate income tax rate than California.
Source: Tax Foundation
The minimum corporation franchise tax in California is $800. A special corporate income tax rate of 10.84% applies to Californias financial institutions.
Source: Federation of Tax Administrators
In fiscal year 2009, state corporate income tax collections were $259 per capita in California, which ranked 5th-highest nationally.
Source: Tax Foundation
In fiscal year 2011, Californias business tax climate ranked 49th overall, according to the State Business Tax Climate Index, falling one place from 2010. The Index compares the 50 states in five areas of taxation that impact businesses: corporate taxes; individual income taxes; sales taxes; unemployment insurance taxes; and property taxes on individuals and businesses.
Source: Tax Foundation
Property Taxes
In 2009, California property taxes as a share of median income for homeowners were 3.6%, ranking the state 15th-highest nationally.
Source: Orange County Register
In fiscal year 2008, state and local property tax collections were $1,449 per capita in California, which ranked 14th-highest nationally.
Source: Tax Foundation
California Tax Facts 2011 – California is Net-Donor State
California taxpayers receive less federal spending per dollar of federal taxes paid than the average state. In fiscal year 2005, California taxpayers received only 78 cents in federal spending for every dollar in federal taxes paid (8th-worst nationally). Twenty years earlier, in 1985, California taxpayers received $1.03 in federal spending for each dollar of federal taxes paid.
Source: Tax Foundation
*This webpage was updated August 2011 using the most recent data available.
