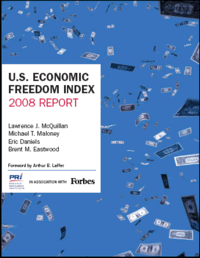
SAN FRANCISCO – The Pacific Research Institute (PRI), a free-market think tank based in California, recently released the U.S. Economic Freedom Index: 2008 Report, a ranking of economic freedom in the 50 states. Published in association with Forbes, the Index scores states based on 143 variables, including regulatory and fiscal obstacles imposed on businesses and residents.
 Index was published), has assumed the notable spot as the nation’s most economically free state, while New York consistently remains the most economically oppressed state, ranking 50 in all three editions of the Index.
The net migration rate for the 20 freest states was 27.36 people per 1,000, while it was a low 1.17 people per 1,000 for the 20 most economically oppressed states. “People are moving to the freest states and fleeing the least free states as our market-based migration metric of economic freedom predicts,” said Lawrence J. McQuillan, Ph.D., director of Business and Economic Studies at PRI and director of the project.
“By measuring economic freedom and studying its effects, people will gain a fuller appreciation of the important imprint it makes on the economic and political fabric of America and will encourage new state legislation that advances economic liberty.
The Index score ranges from 1 (most free) to 50 (least free), and state rankings were derived from the index scores. The Index collected and ranked 143 indicators comprised of 209 underlying variables from five sectors (fiscal, regulatory, judicial, size of government, and welfare spending) for each state to measure how friendly, or unfriendly, each state’s government policies are toward free enterprise and consumer choice.
MP: The chart above shows my own analysis of the the average unemployment rates for each of the four quartiles of states (state unemployment rates here), ranked by economic freedom. For the quartile of states that are most economically free, the October 2008 unemployment rate was 4.7%, compared to the 6.7% average jobless rate for the quartile of states that are the least economically free.
Bottom Line: The more economically free a state is, the lower its unemployment rate. The less economically free a state is, the higher its unemployment rate. The difference in average unemployment rates between the quartile of states with the greatest economic freedom and the quartile of states with the least economic freedom is a whopping 2%.
More Economic Freedom = Lower Jobless Rate
Mark J. Perry
SAN FRANCISCO – The Pacific Research Institute (PRI), a free-market think tank based in California, recently released the U.S. Economic Freedom Index: 2008 Report, a ranking of economic freedom in the 50 states. Published in association with Forbes, the Index scores states based on 143 variables, including regulatory and fiscal obstacles imposed on businesses and residents.
The net migration rate for the 20 freest states was 27.36 people per 1,000, while it was a low 1.17 people per 1,000 for the 20 most economically oppressed states. “People are moving to the freest states and fleeing the least free states as our market-based migration metric of economic freedom predicts,” said Lawrence J. McQuillan, Ph.D., director of Business and Economic Studies at PRI and director of the project.
“By measuring economic freedom and studying its effects, people will gain a fuller appreciation of the important imprint it makes on the economic and political fabric of America and will encourage new state legislation that advances economic liberty.
The Index score ranges from 1 (most free) to 50 (least free), and state rankings were derived from the index scores. The Index collected and ranked 143 indicators comprised of 209 underlying variables from five sectors (fiscal, regulatory, judicial, size of government, and welfare spending) for each state to measure how friendly, or unfriendly, each state’s government policies are toward free enterprise and consumer choice.
MP: The chart above shows my own analysis of the the average unemployment rates for each of the four quartiles of states (state unemployment rates here), ranked by economic freedom. For the quartile of states that are most economically free, the October 2008 unemployment rate was 4.7%, compared to the 6.7% average jobless rate for the quartile of states that are the least economically free.
Bottom Line: The more economically free a state is, the lower its unemployment rate. The less economically free a state is, the higher its unemployment rate. The difference in average unemployment rates between the quartile of states with the greatest economic freedom and the quartile of states with the least economic freedom is a whopping 2%.
Nothing contained in this blog is to be construed as necessarily reflecting the views of the Pacific Research Institute or as an attempt to thwart or aid the passage of any legislation.